Â

- Customer: Kyoto University – Department of Chemical Engineering
- Industry: Education
- Solution: Moldex3D Solution Add-on / Moldex3D MuCell®
- Country: Japan
- View PDF Version
Executive Summary
Researchers in the Kyoto University have modified foam injection molding experiments with core-back operation and they wanted to clarify the effects of process parameters on the cell morphology and the final product. Moldex3D MuCell® helped them to understand the physical phenomena happening throughout the whole foaming process, and provided a suitable operation parameter range to produce a high-quality product.
Objectives
- Interpretation of experimental results via simulation tool
- To improve experimental design of core-back operationÂ
Solutions
Utilized Moldex3D microcellular injection molding solution to get a deep understanding on cell morphology (including cell size and density), part density in a microscope approach in core-back foam injection molding process.
Benefits
- Be able to predict foaming behaviors
- Attain suitable operation parameter range to produce a high-quality product
Case Study
In order to produce a high expansion ratio product compared to the traditional microcellular injection molding, Kyoto University researchers designed a new foam injection molding process which partially extracts the back of the mold after a certain period of time where cavity is full-filled. After this modification, the core-back process will form a much thicker, but much less dense part, and also can be made with lower amounts of plastic resin materials. The researchers decided to use Moldex3D MuCell® to validate their experimental data of this new process.
The objective of this case is to understand the effects of MuCell® process parameters such as core-back distance, nitrogen gas concentration, and dwelling time on the cell morphology (including the cell size and cell density). Thus, Kyoto University researchers utilized Moldex3D microcellular solution to simulate core-back foam injection molding process (Fig. 1). Then, they would like to compare the simulation results with experimental data in order to validate the accuracy of simulation analysis and further apply it in real-world molding.
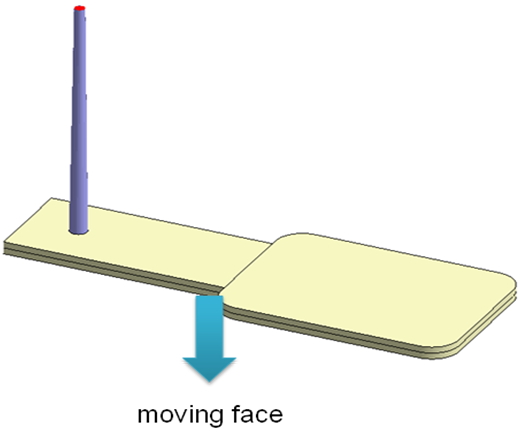 Fig. 1 Â The geometry model used in this case to simulate core-back foam injection molding
Through Moldex3D MuCell®, Kyoto University researchers were able to observe the effects of three process parameters: core-back distance, nitrogen gas concentration, and dwelling time. Firstly, according to the analysis result, they found out that as the core-back distance increases, the final product density decreases (Fig. 2). While the core-back distance increases from 0 mm to 8 mm, part density can reduce by 30%, which means the part weight can be reduced by 30%.
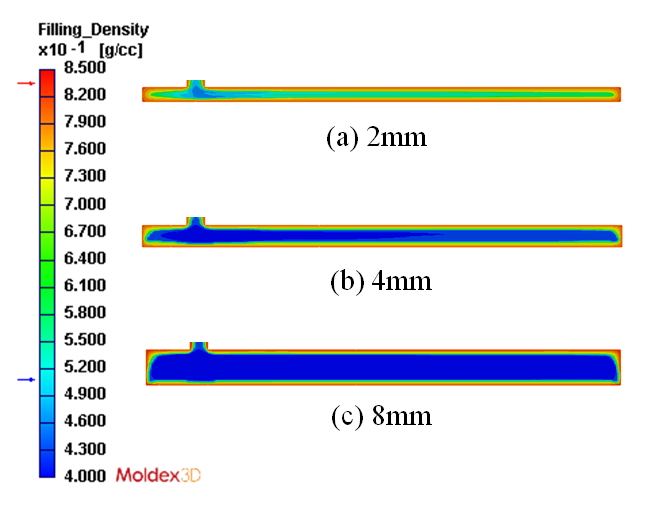 Fig. 2 Â The part density of three different core-back distances: (a) 2 mm, (b) 4mm and (c) 8mm. As shown,
when core-back distance increases, the cell density decreases
Secondly, they observed that as nitrogen concentration increases, the cell density increases due to a higher cell nucleation rate and further cause the cell diameter to decrease (Fig. 3). Finally, as dwelling time increases, the molten polymer solidifies more, causing a higher melt viscosity and resulting in smaller or no bubbles when the core-back process finishes. As shown in Fig.4 (left), the cell density decreases rapidly as the dwelling time is longer than 10 seconds. In Fig.4 (right), there are almost no bubbles when the dwelling time is longer than 7 seconds.
After running the simulation analysis, they compared the simulation results with experiment results on these parameters. All of the simulation results are very consistent with the experiment results and experimental data (Fig. 3 & Fig. 4).
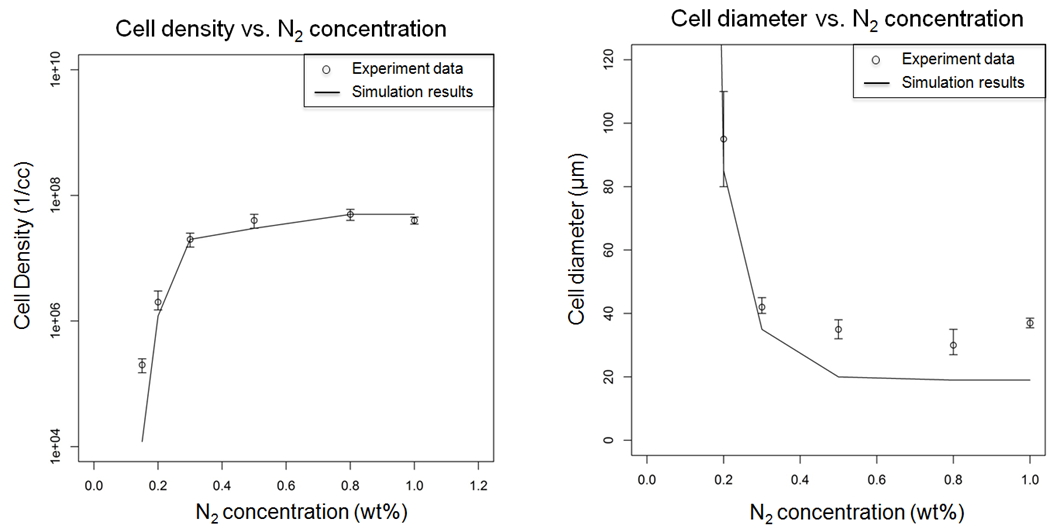 Â Fig. 3 Â The relation between cell density versus gas concentration (left) and the relation between cell diameter versus gas concentration (right). As shown, the simulation result and experimental data have a similar trend.
 Fig. 3  The relation between cell density versus gas concentration (left) and the relation between cell diameter versus gas concentration (right). As shown, the simulation result and experimental data have a similar trend.
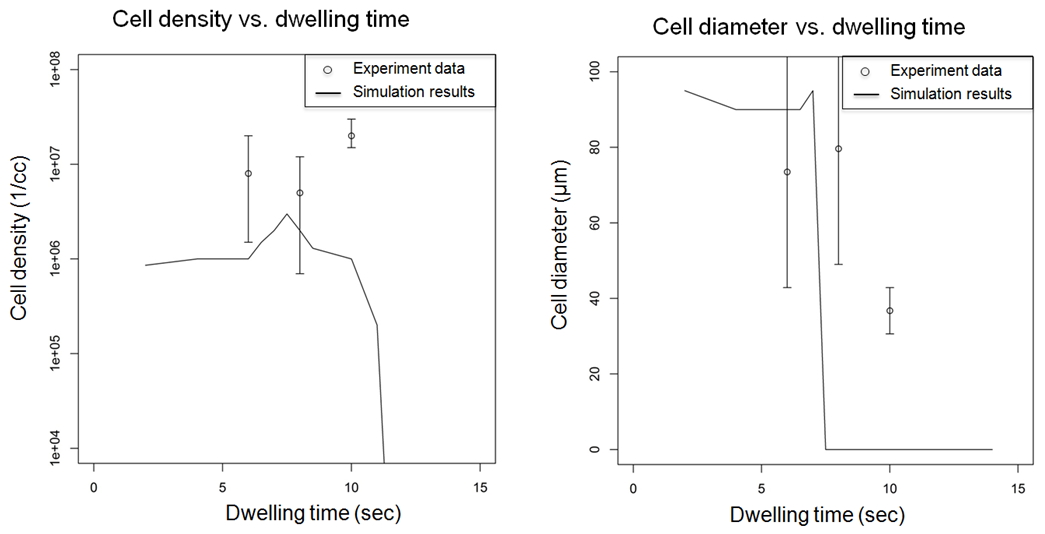 Fig. 4 Â The relation between cell density versus dwelling time (left) and the relation between cell diameter versus dwelling time (right). As shown, the simulation result and experimental data have a similar trend.
Results
Through Moldex3D analyses, researchers in Kyoto University could clearly understand the effects of process parameters on the cell morphology and part density. The accuracy of Moldex3D simulation analysis was later validated by the experimental data (Table 1). In the end, researchers were able to predict the foaming behaviors. The morphological prediction can be valuable information to correlate the mechanical properties of a foam injection molded product. Although, the cell morphology could be more complex and unexpected in a molded product, simulation tool still could provide a close approximation on cell structure in an economic way.
|
Core-back distance |
Experimental cell diameter (μm) |
Simulated cell diameter (μm) |
Experimental cell density (1/cc) |
Simulated cell density (1/cc) |
| 2mm | 85 | 80 | 3Â x 106 | 2Â x 106 |
| 4mm | 90 | 95 | 2Â x 106 | 9Â x 105 |
| 8mm | 155 | 105 | 1Â x 106 | 7Â x 105 |
Table 1 Comparison between experimental data and simulation results
The Brushless DC Motor for electric tricycles, four wheeled vehicles, cruise ships, sightseeing vehicles, lawn mowers, etc. 48~72V
Differential Motor,2200W Brushless Dc Motor,1200W Dc Brushless Motor,Permanent Magnet Motor
Changzhou Lead Machinery Technology Co.,Ltd , https://www.leaddryer.com